 | 09 Sep 2024
Rockfall, glacier recession, and permafrost degradation: long-term monitoring of climate change impacts at the Open-Air-Lab Kitzsteinhorn, Hohe Tauern
Ingo Hartmeyer
Jan-Christoph Otto
Hartmeyer, I. and Otto, J.-C.: Rockfall, glacier recession, and permafrost degradation: long-term monitoring of climate change impacts at the Open-Air-Lab Kitzsteinhorn, Hohe Tauern, DEUQUA Spec. Pub., 5, 3–12, https://doi.org/10.5194/deuquasp-5-3-2024, 2024.
Since 2010, comprehensive geoscientific monitoring has been established in the summit region of the Kitzsteinhorn (“Open-Air-Lab Kitzsteinhorn”), which focuses on the investigation of high-alpine climate change impacts in four monitoring domains: air temperature, glaciation, permafrost, and rock stability. Air and near-surface permafrost temperatures are currently rising with mean rates of almost +0.1 °C yr−1. The thickness of the local cirque glacier is decreasing by more than 1 m yr−1. Rockwall monitoring demonstrates that rockfall activity in freshly deglaciated rockwall sections has increased by 1 order of magnitude. The intensity of the observed processes is most likely unprecedented in recent human history. This emphasizes the importance of long-term monitoring efforts such as those carried out at the Kitzsteinhorn for improved geophysical understanding and for safe and sustainable infrastructure operation in high-alpine environments.
- Article
(8219 KB) - Full-text XML
- BibTeX
- EndNote


Research activities in the summit region of the Kitzsteinhorn are driven by the particularly rapid progression of climate change in mountainous regions and its severe impact on geomorphic processes, natural hazard occurrence, and alpine infrastructure safety (Duvillard et al., 2021). In the past century alone, the average temperature in the Alpine region has increased by around 2 °C, which is twice as much as the global average increase during the same time period (Begert and Frei, 2018; Kotlarski et al., 2023).
Glacier recession represents the most visible consequence of this significant warming trend (WGMS, 2023). Less obvious changes such as permafrost degradation (warming–thawing of permanently frozen ground) are more difficult to identify but have potentially serious consequences. A reduction in rock and slope stability, local subsidence, and increased rockfall activity are among the direct consequences of permafrost degradation (Gruber and Haeberli, 2007; Krautblatter et al., 2013).
However, due to buffering effects, the consequences of climate warming are often not immediately visible but rather emerge after significant lag times spanning years or even decades. Systemic long-term monitoring of the underlying processes, such as that conducted at the Kitzsteinhorn in the sense of an “open-air laboratory”, is therefore crucial for a robust, quantitative understanding of high-alpine climate change and its impacts and for estimating future changes.
Since 2010, comprehensive geoscientific monitoring has been established in the summit region of the Kitzsteinhorn, studying the surface, subsurface, and atmosphere. Here we present excerpts of research findings, which center around the question of how glacier retreat and permafrost degradation alter rock stability and impact infrastructure safety. Results are summarized in four sections: air temperature (Sect. 3.1), glaciation (Sect. 3.2), permafrost (Sect. 3.3), and rock stability (Sect. 3.4).
The Kitzsteinhorn (3203 m a.s.l.) is located in the Hohe Tauern range, Salzburg, Austria (Fig. 1). Its summit pyramid belongs to the Bündner schist formation (Glockner Nappe) and is primarily composed of calcareous mica schist, with other rocks such as prasinite, amphibolite, phyllite, marble, and serpentinite also present to a lesser extent (Cornelius and Clar, 1935; Hoeck et al., 1994). Due to its high elevation (existence of glaciers and permafrost), distinct topography (isolated summit pyramid), and easy accessibility (cable car), the Kitzsteinhorn is exceptionally well suited for the long-term monitoring of high-alpine climate change impacts.
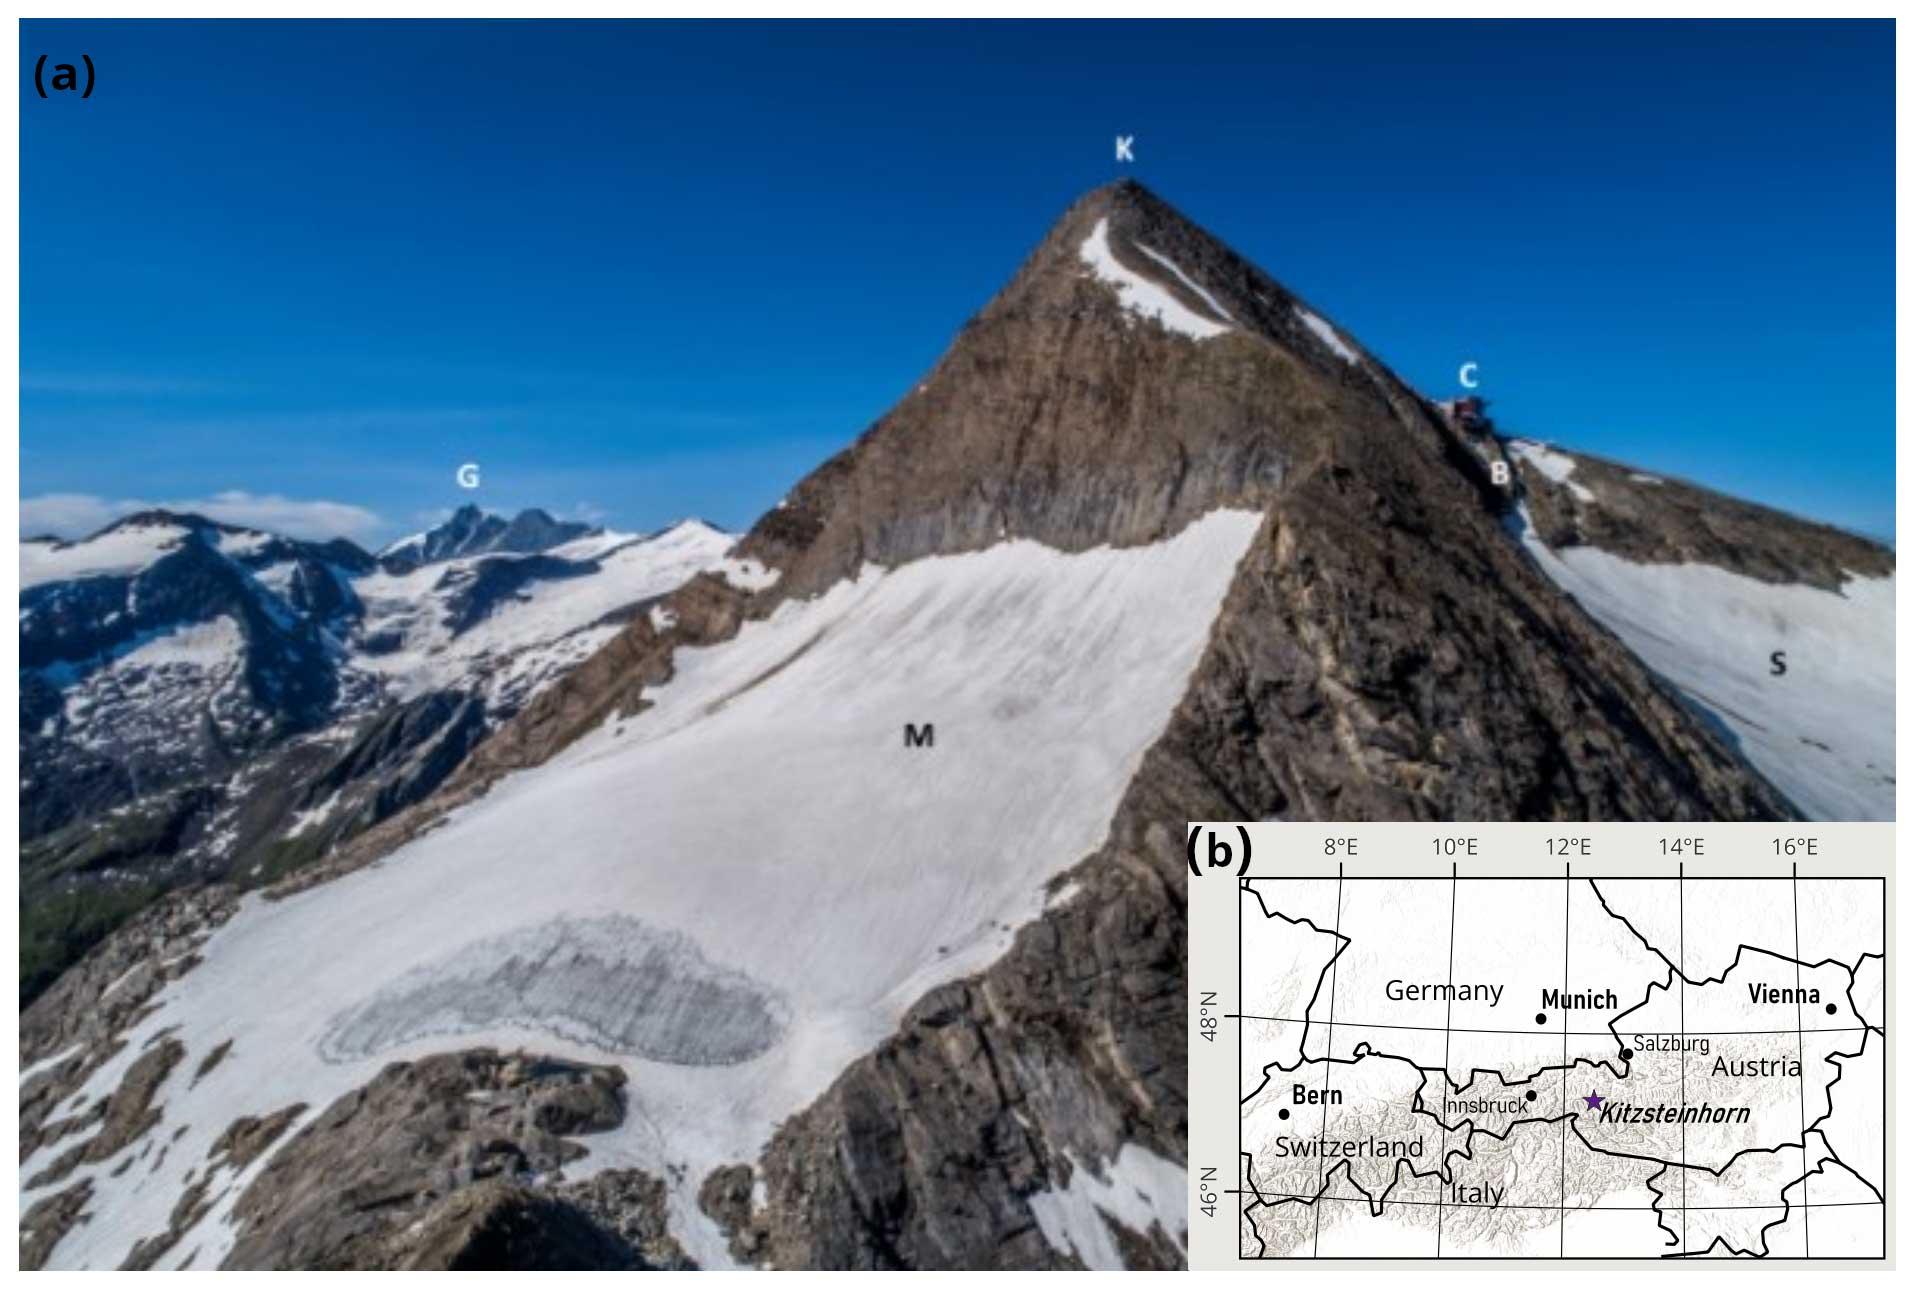
Figure 1(a) The summit pyramid of the Kitzsteinhorn hosts the long-term monitoring project “Open-Air-Lab Kitzsteinhorn”, which investigates the impacts of climate warming (e.g., permafrost degradation, glacier retreat) and their effect on rock stability. K, Kitzsteinhorn (3203 m a.s.l.); C, cable car top station (3030 m a.s.l.); S, Schmiedingerkees glacier; M, Maurerkees glacier; B, permafrost borehole; G, Großglockner (3797 m a.s.l.). (b) Location of the study site.
In addition to its excellent natural and infrastructural suitability, the Kitzsteinhorn represents one of the most diverse mountains in the entire Alps. It hosts Austria's oldest glacier ski area and has evolved into one of the countries most visited high-alpine tourist destinations, attracting around 1 million visitors per year. At the same time, large parts of the mountain are under strict nature protection (Nationalpark Hohe Tauern), while other parts are used for energy production by the Kaprun hydropower plant group. The coexistence of tourism, nature conservation, and energy production highlights the significant socio-economic and cultural impact of the Kitzsteinhorn and underscores the relevance of the research conducted here.
Systemic long-term observations in the Kitzsteinhorn summit region were initiated in 2010. Since then, unique and constantly expanding high-alpine research infrastructure has been established, aiming to identify and quantify changes related to climate warming. By combining atmospheric, surface, and subsurface measurements, slope stability-relevant variables are directly observed to identify potentially critical threshold values. Observation of rock instability can thus be directly related to the rapid warming of high-alpine environments. The high density of sensors and measuring instruments contributes to the laboratory character of the study site, and approaches include, among others, (i) borehole (30 m deep) temperature measurements, (ii) electrical resistivity surveys to capture ground thermal conditions, (iii) terrestrial laser scanning to quantify rockfall activity, (iv) UAV (unoccupied aerial vehicle) photogrammetry, (v) ground-penetrating radar to document glacier retreat, (vi) geotechnical monitoring to register bedrock deformation (inclinometers, crackmeters, anchor load plates), and (vii) automatic weather stations to record atmospheric boundary conditions.
To increase the visibility of the research activities carried out at the Kitzsteinhorn, the Open-Air-Lab Kitzsteinhorn is associated with renowned national and international research networks and databases such as GTN-P (Global Terrestrial Network for Permafrost), VAO (Virtual Alpine Observatory), TUM-ALPHA (Research Center and Early Warning System for Alpine Natural Hazards), CCCA (Climate Change Centre Austria), and KryoMon.AT (Kryosphären Monitoring Österreich, translated as Cryospheric Monitoring Austria).
3.1 Air temperature
Air temperature is recorded at three automatic weather stations located in the immediate vicinity (Fig. 2): (i) “Alpincenter” (2450 m a.s.l., 2.2 km N of the summit), (ii) “Kammerscharte” (2595 m a.s.l., 1.8 km NE of the summit), and (iii) “Gletscherplateau” (2920 m a.s.l., 0.6 km W of the summit). Temperature measurements started in 2008 at Alpincenter and in 2009 at Kammerscharte and Gletscherplateau.
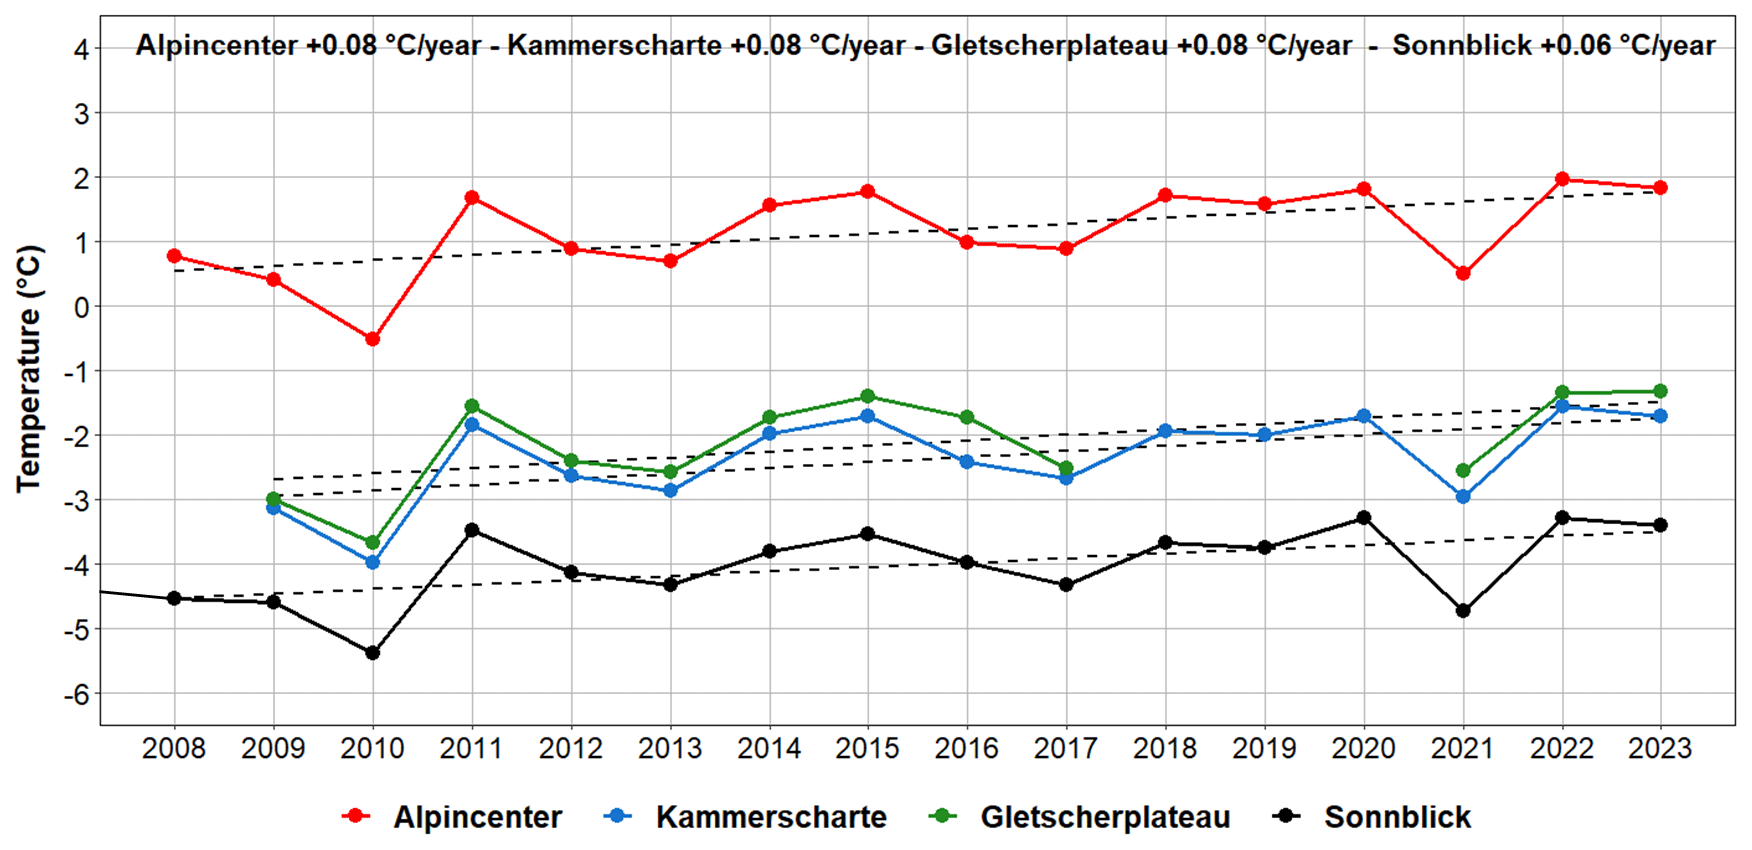
The past year, 2023, was the hottest year on record at Gletscherplateau and the second-hottest year at Alpincenter and Kammerscharte. The annual average temperature was 0.7 °C above the recorded average since measurements began at Alpincenter (since 2008) and Kammerscharte (since 2009) and 0.9 °C above the average at Gletscherplateau (since 2009). Trend analyses for the period 2008/2009–2023 show a significant warming trend of +0.08 °C yr−1 (+0.8 °C per decade) at all three Kitzsteinhorn weather stations. A comparison with the high-alpine reference weather station at “Sonnblick” (3106 m a.s.l.), located 25.7 km from the Kitzsteinhorn, shows a similar trend (+0.06 °C yr−1) (GeoSphere Austria, 2024).
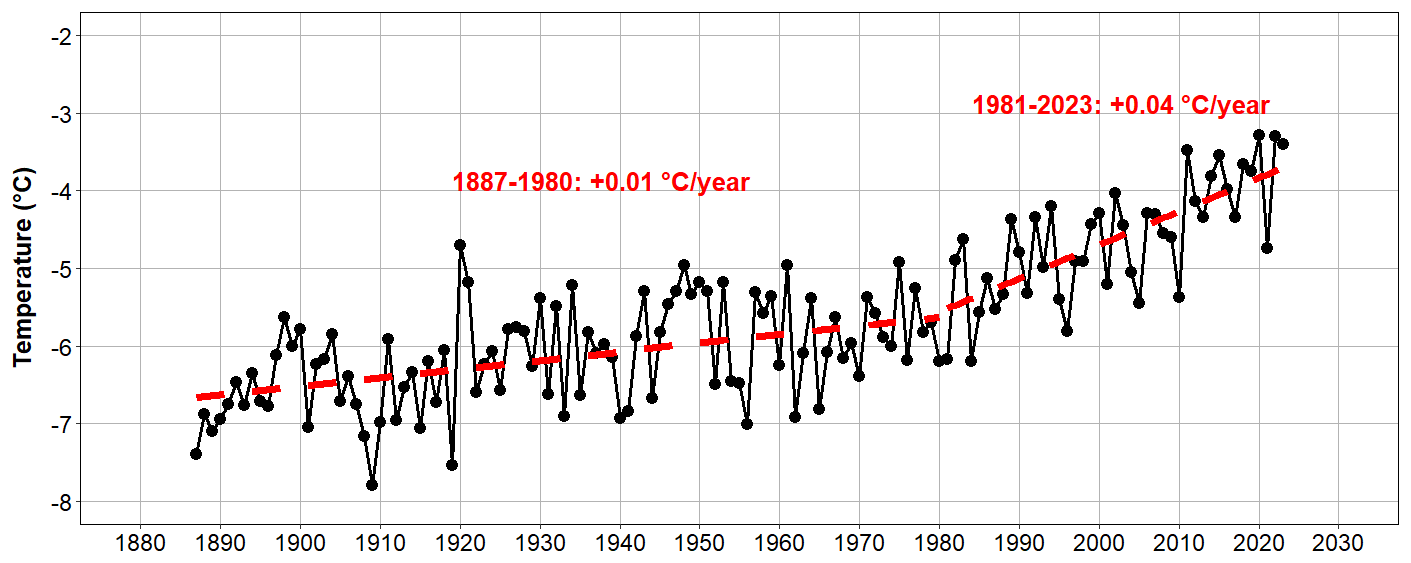
Figure 3Long-term temperature increase (1887–2023) at weather station Sonnblick (3106 m a.s.l.), located 25 km from the Open-Air-Lab Kitzsteinhorn (data source: GeoSphere Austria, 2024).
Long-term analyses dating back to 1887 with data from Sonnblick demonstrate a distinct acceleration in warming over the last few decades (Fig. 3). While warming from 1887–1980 was just +0.01 °C yr−1, it was +0.04 °C yr−1 in the period 1981–2023 and +0.06 °C yr−1 in the period 2001–2023. These findings are in line with numerous other observations from the Alpine region, which have found significantly accelerated warming since the 1980s (European Environment Agency, 2009; Philipona, 2013).
3.2 Glaciation
Since 2016, the local cirque glaciers (Schmiedingerkees and Kammerkees) have been studied based on a total of 25 UAV (unoccupied aerial vehicle) surveys. As part of the surveys, the terrain surface was captured photogrammetrically and georeferenced using permanent ground control points. The subsequent analysis of overlapping image areas (“structure from motion”) allows the creation of high-resolution 3D point clouds and the reconstruction of area and volume changes to the glacier. The total area surveyed by UAV photogrammetry is approximately 6 km2, and the ground sampling distance equals around 10 cm. Glacier changes before 2016 were assessed based on data available in historical databases (Fischer et al., 2015).
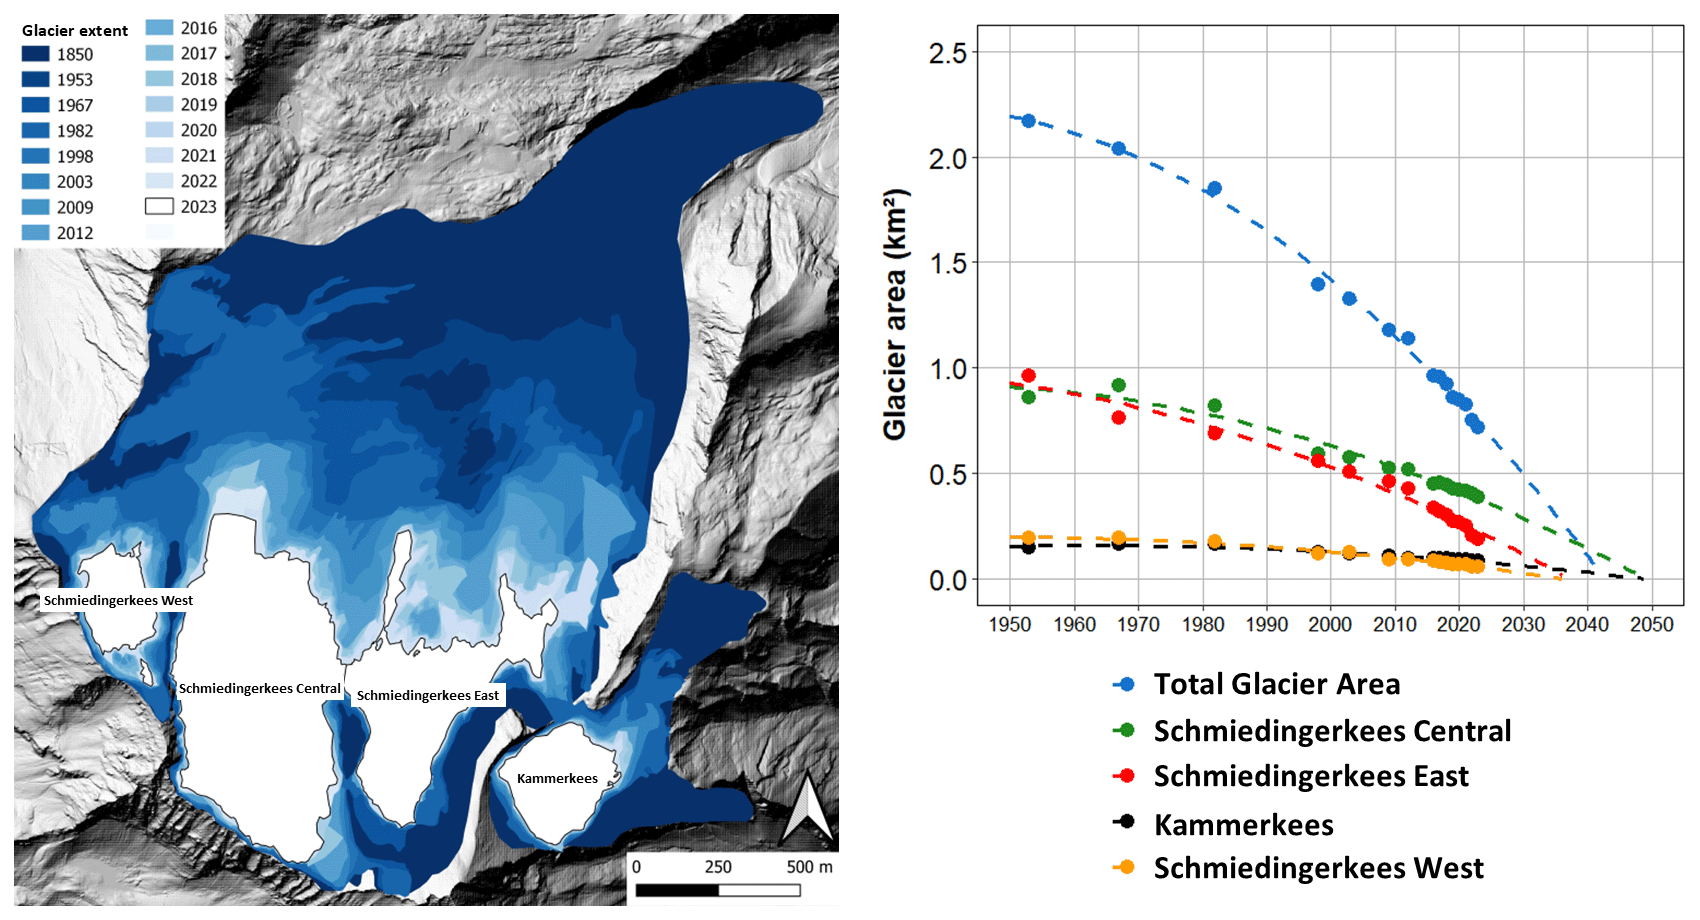
Figure 4Loss of glacier area since 1850 at the Kitzsteinhorn (Schmiedingerkees and Kammerkees) (1850 glacier extent from Fischer et al., 2015).
Between 1953 (first aerial survey) and 2023, the studied glacier area decreased from 2.17 to 0.71 km2 (−1.46 km2) (Fig. 4). The glaciated area has therefore shrunk by around 67 % over the past 70 years. The greatest area loss (since 1953) was recorded in the Schmiedingerkees East section (−80 %), followed by Schmiedingerkees West (−71 %), Schmiedingerkees Central (−55 %), and Kammerkees (−44 %). High losses in the Schmiedingerkees East section are most likely related to the heterogeneous relief of the glacier forefield, which favors the formation of small glacier tongues prone to strong ablation. Extremely hot summers, such as the summer of 2022, had a significant impact on the recession of the studied glaciers. Between the UAV summer surveys of 2021 and 2022 alone, the glaciated area decreased by over 9 %. This was the largest measured or reconstructed area loss within a single year since records began in 1953.
In accordance with the temperature measurements, the long-term glacier loss does not follow a linear trend but shows a clear acceleration (Fig. 4). In the last 14 years alone (2009–2023), the glacier area decreased by 37 %. Extrapolation of the area loss from the past 70 years to the future suggests that the investigated glacier could disappear in the 2040s. This trend might, however, slow down as the glacier retreats into shaded areas.
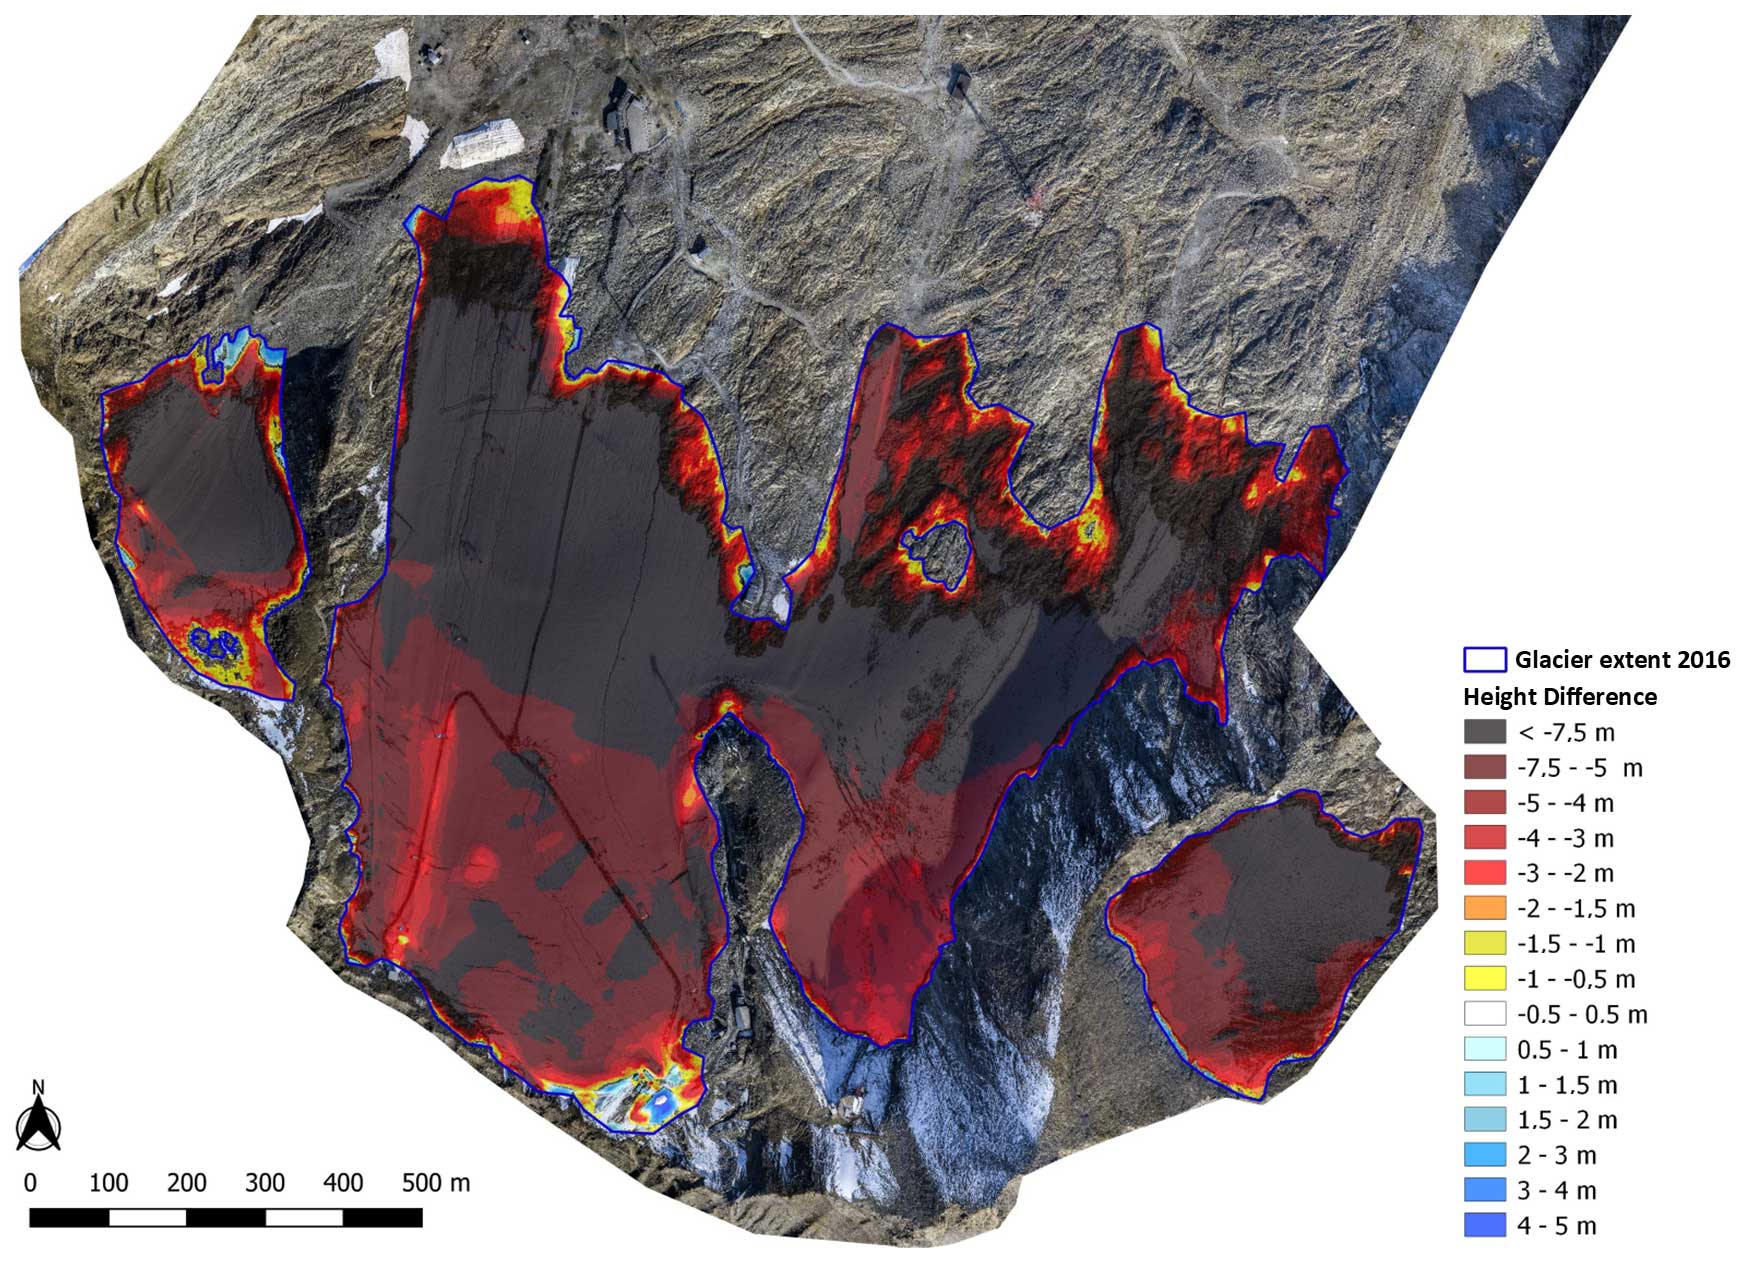
Figure 5Total surface lowering of the cirque glaciers at the Kitzsteinhorn between 2016 and 2023.
Combined analyses of airborne lidar data (2008), photogrammetry surveys (2016), and GPR (ground-penetrating radar) ice thickness measurements (2016) demonstrate a glacier volume of 29.7×10⁶ m3 for the Schmiedingerkees Central and Schmiedingerkees East sections for 2008. The most recent survey in September 2023 delivered a glacier volume of only 16.0×10⁶ m3, representing a decrease of 13.7 ×10⁶ m3 in the last 15 years, which equals a loss of 46.1 %. From 2008–2023 the average thickness of the investigated glacier areas decreased by 1.1 m yr−1 (Fig. 5).
3.3 Permafrost
In Austria, direct permafrost temperature measurements, i.e., measurements in deep boreholes, are restricted to two sites – Hoher Sonnblick and the Kitzsteinhorn. This scarcity of sites with direct measurements underlines the importance of the data acquired at Sonnblick and the Kitzsteinhorn for the understanding of current and future permafrost evolution in Austria and the Eastern Alps. At the Open-Air-Lab Kitzsteinhorn, seven deep boreholes collect data on permafrost temperatures at different depths. In this contribution, we focus on the longest time series available at the Kitzsteinhorn, recorded at borehole B2, located around 50 m below the cable car top station. The 30 m deep borehole B2 was drilled perpendicular to the north-facing rock slope, which has a mean gradient of about 45°. Borehole B2 is considered to be undisturbed by anthropogenic impacts such as the cable car top station. Temperature measurement inside the borehole is carried out with high-quality thermistors with an accuracy of ±0.03 °C (Platinum Resistance Temperature Detector L220, 1/10 B, Heraeus Sensor Technology®) at 12 depths (0.1, 0.5, 1, 2, 3, 5, 7, 10, 15, 20, 25, 30 m). Inside the borehole, the thermistors are mechanically coupled to brass segments which are integrated into the PVC casing that protects the borehole from water entry. Due to the high thermal conductivity of the brass segments (∼ 110 W m−1 K−1), this specifically designed solution enables excellent thermal coupling between the temperature sensors and the surrounding bedrock, allowing reliable measurements of small temperature changes.
The temperature record from borehole B2 covers 8 full years (2016–2023). Ground thermal conditions of the near-surface regions are characterized by strong diurnal and seasonal fluctuations related to atmospheric temperature changes. With increasing depth, fluctuations are damped, indicating a reduced impact of external conditions on the ground temperature. At 15 m depth, ground temperature varies by just a few tens of a degree over a year. The depth of zero annual amplitude, which represents the depth at which seasonal fluctuations can no longer be observed, is situated at around 20 m. Slow, conduction-dominated heat propagation leads to significant lag times between ground surface warming and cooling and changes at depth. Temperature variations take around half a year to arrive at a depth of 10 m (PERMOS, 2023).
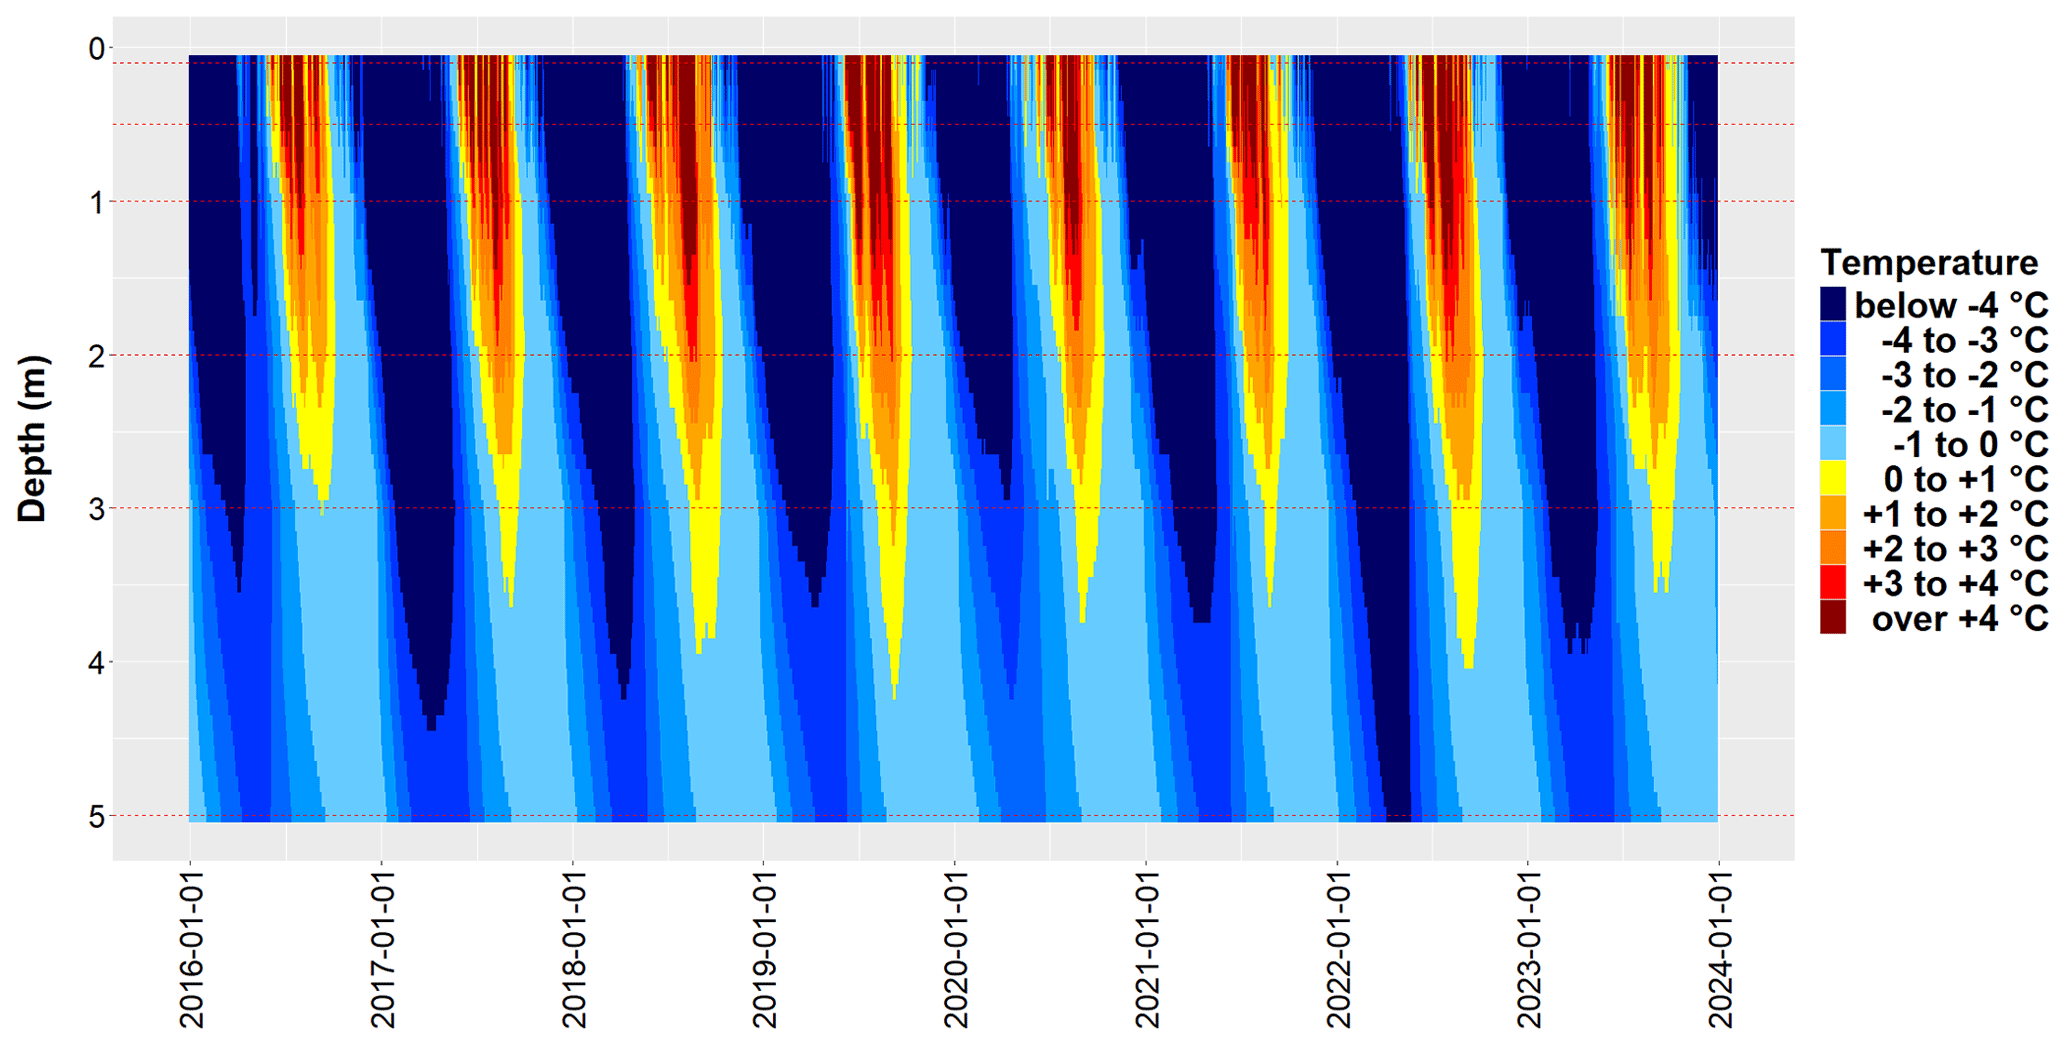
Figure 6The 8-year bedrock temperature record measured at permafrost borehole B2 within the first 5 m (2016–2023). Meter indications refer to the maximum thickness of the permafrost active layer in each summer. Sensor depths are indicated by dotted red lines. Linear interpolation at 0.1 m depth increments was used to model ground temperature between sensors.
In the summer season, the uppermost layer of the subsurface thaws. This so-called active layer is usually initiated in June and reaches its maximum thickness between the end of August and mid-September. Subsequent seasonal cooling then leads to a complete refreezing of the active layer, which usually takes about 1 month and is completed in October. The multi-year (2016–2023) active layer evolution is illustrated in Fig. 6. From 2016–2019 a growth trend was observed for four consecutive summers. In the summer of 2019, the active layer thickness reached its highest value (4.2 m) of the entire observation period. In the two following summer periods (2020, 2021), the active layer thickness reached 3.7 and 3.6 m, respectively. During the extremely hot summer of 2022, the active layer thickness reached “only” 4.0 m. This is most likely related to the cold preceding winter period. Significant subsurface cooling could not be completely offset by the ensuing hot summer.
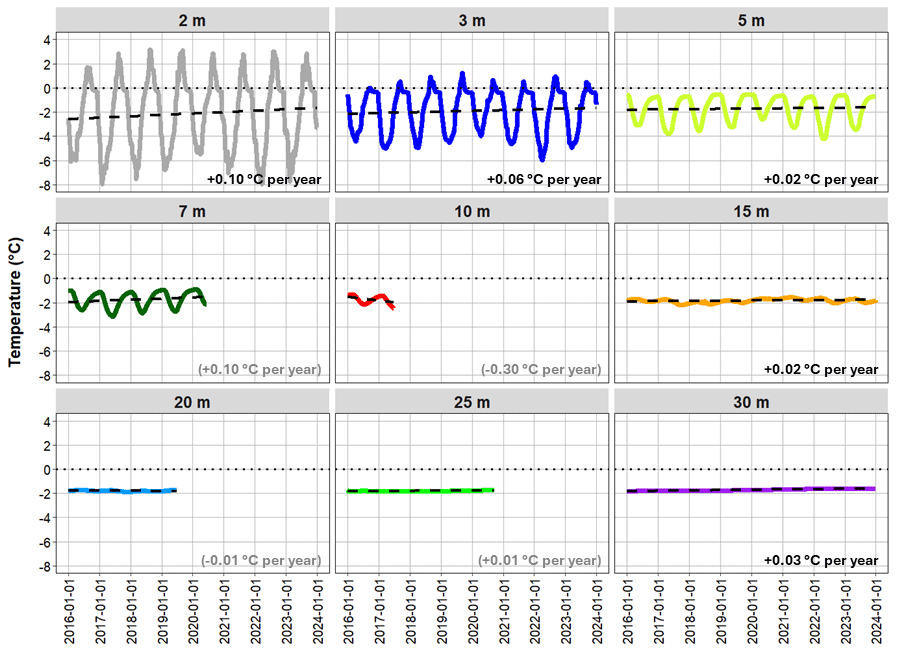
Figure 7Temperature data and regression analysis for permafrost borehole B2 at different depths (2016–2023). Warming is evident for all (completely) recorded depths and is significantly more pronounced in near-surface regions. Permanent sensor failure occurred after lightning strikes at 7 m (14 June 2020), 10 m (24 June 2017), 20 m (1 July 2019), and 25 m (16 September 2020).
Regression analyses carried out for the full 8-year observation period (2016–2023) demonstrate a clear warming trend (Fig. 7). Warming is significantly more pronounced for near-surface regions (e.g., 2, 3 m) and is in agreement with recent air temperature rise (refer to Sect. 3.1). With increasing borehole depth, the observed warming trend is attenuated considerably to only a few hundredths of a degree per year (e.g., 15, 30 m). Ground temperature at large depth thus reacts with significant delay to atmospheric warming. These findings are consistent with previous modeling studies that found significant lag times between climate warming and thermal response at depth (e.g., Noetzli et al., 2007). Lag times have important implications for our understanding of the response time of temperature-induced destabilization at depth.
3.4 Rock stability
Rock stability at the Open-Air-Lab Kitzsteinhorn is monitored based on a combination of remote sensing techniques and in situ geotechnical monitoring. Here we present the results of a 12-year remote sensing survey and introduce the implemented geotechnical monitoring.
Since August 2011, four rock faces in the study area have been systematically examined annually using high-resolution terrestrial laser scanning to identify rockfall source areas (Hartmeyer et al., 2020a, b). Laser scanning is an active 3D imaging method well-suited to identifying surface change in steep bedrock. The studied rock faces comprise a surface area of around 230 000 m2 and are located immediately adjacent to the Schmiedingerkees glacier.
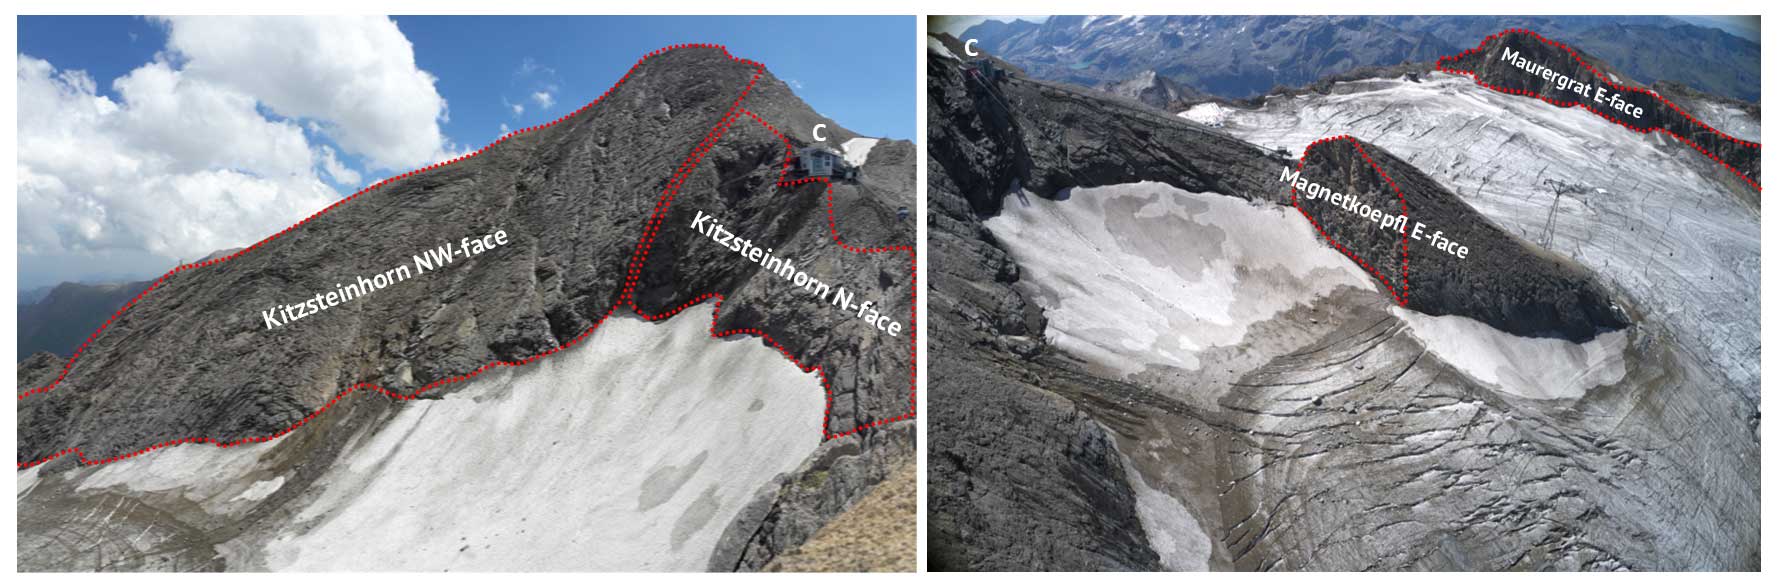
Figure 8Rockwalls surveyed with terrestrial laser scanning at the Kitzsteinhorn (C, cable car top station).
Laser scanning of the four examined rockwalls (Fig. 8) is carried out during snow-free periods (end of August/beginning of September) at least once a year. The laser-scanning survey conducted at the Kitzsteinhorn is among the most extensive high-altitude rockfall monitoring campaigns in the world in terms of observation duration and level of detail, allowing precise quantification of rockfall activity following glacier retreat.
During the 12-year laser-scanning campaign (August 2011 to August 2023), 799 rockfall source areas (which are here referred to as “rockfalls” to improve readability) with a total volume of 3340 m3 were identified. The majority of the registered rockfalls had small volumes. Exactly 84 % of the identified events were smaller than 1 m3, and only six events (0.8 %) were larger than 100 m3. The largest event recorded had a volume of 879.4 m3. The magnitude–frequency distribution of the rockfalls identified at the Kitzsteinhorn follows a pronounced power law function over 4 orders of magnitude.
Rockfall activity was highest in the Kitzsteinhorn north face, where the terrain gradient follows cleavage dip (calcareous mica schist) and facilitates large dip-slope failures of cubic rock bodies. Rockfall activity in the Kitzsteinhorn north face (71.5 m3 ha−1 yr−1) was almost 6 times higher than the mean value over all sites (12.2 m3 ha−1 yr−1).
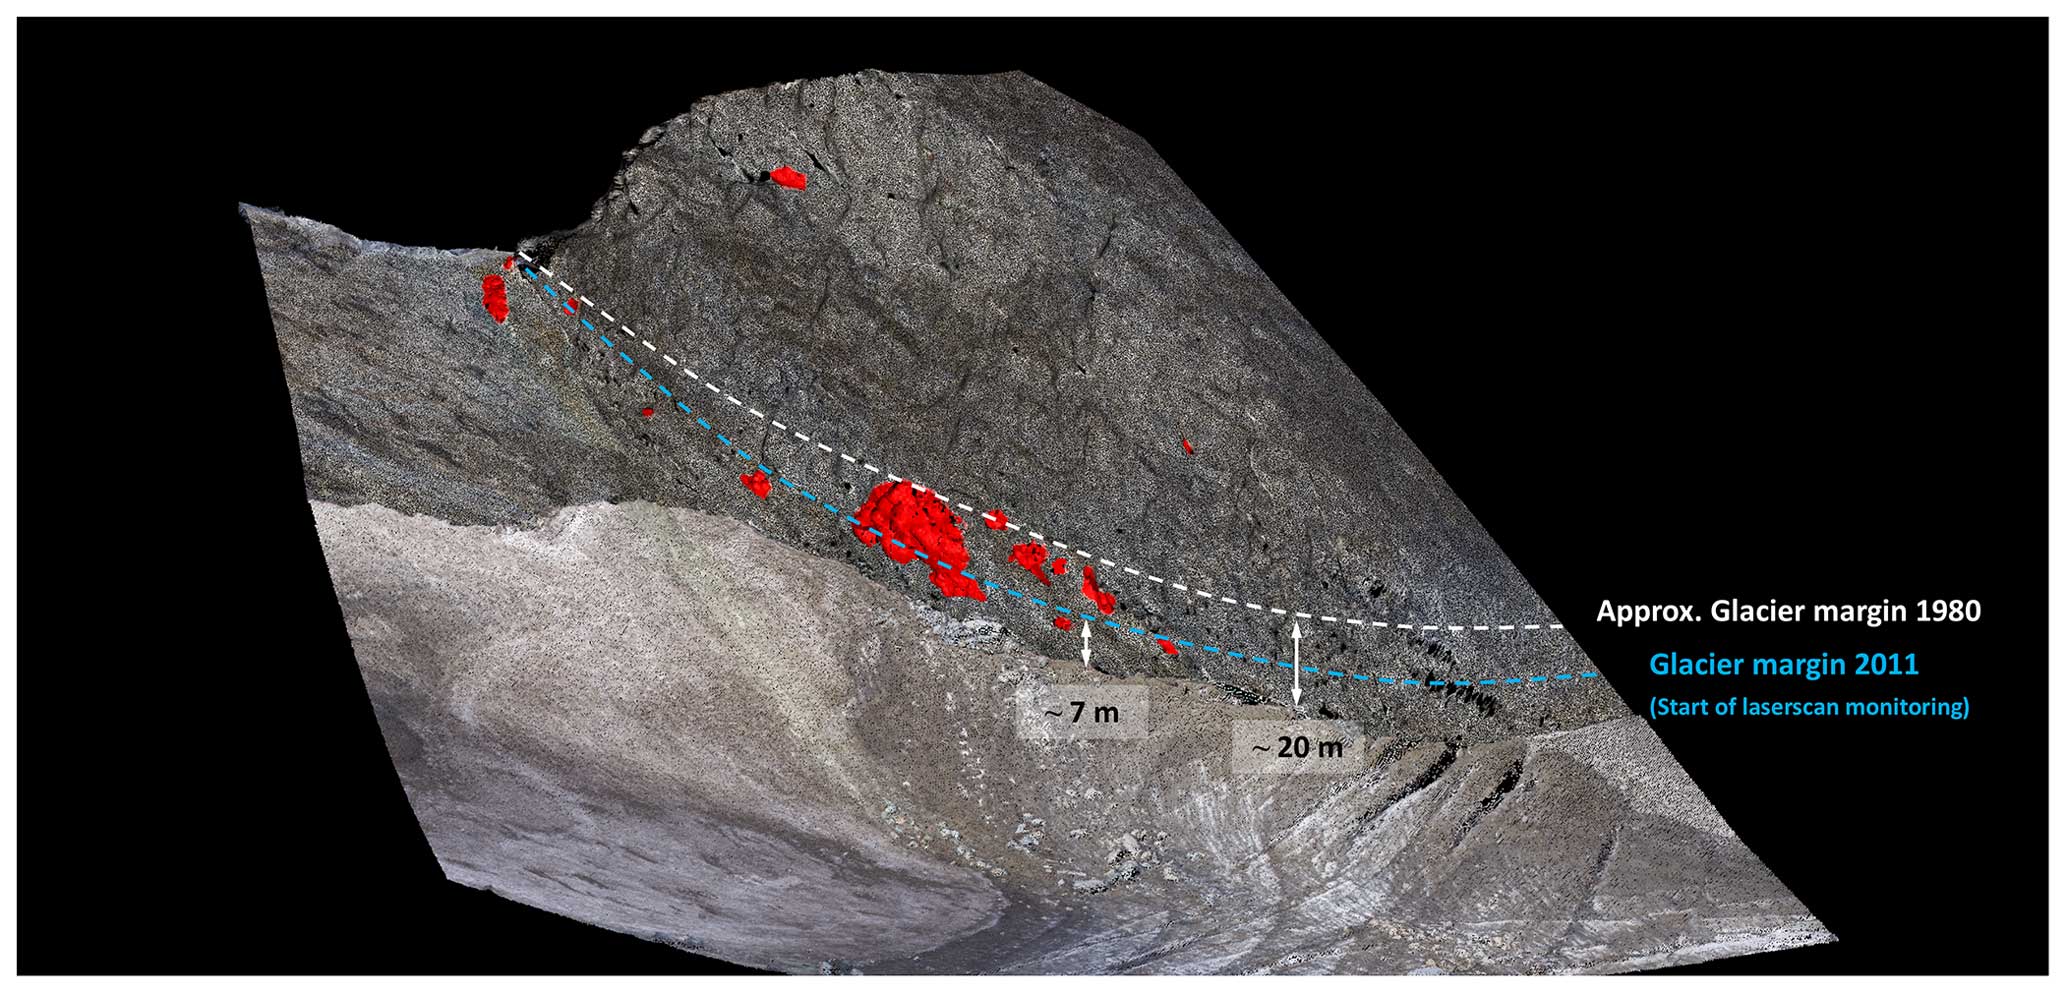
Figure 9Rockfall source areas (> 0.5 m3) identified in the east face of the Magnetköpfl (2011–2023). For all rockwalls, significantly increased rockfall activity has been found in freshly deglaciated rockwall sections.
A significant increase in rockfall activity close to the glacier surface (base of the rockwall) was observed for all the rockwalls studied (Fig. 9). More than 60 % of the total rockfall volume originated from source areas located less than 10 m above the current glacier surface. Rockfall activity in these “proximal” areas is 9.8 times higher than in areas located more than 10 m above the current glacier surface. The mean annual rockwall retreat rate equaled 5.36 mm yr−1 in proximal regions and only 0.55 mm in distal regions located more than 10 m above the glacier.
The highly active rockwall areas near the glacier surface primarily involve regions that have been exposed in recent years or decades due to downwasting of the adjacent Schmiedingerkees glacier. Freshly exposed rock surfaces are therefore considered particularly unstable. The loss of glacial shielding leads to strong seasonal fluctuations in rock temperatures, melting of ground ice, and increased water infiltration – resulting in massively increased destabilization.
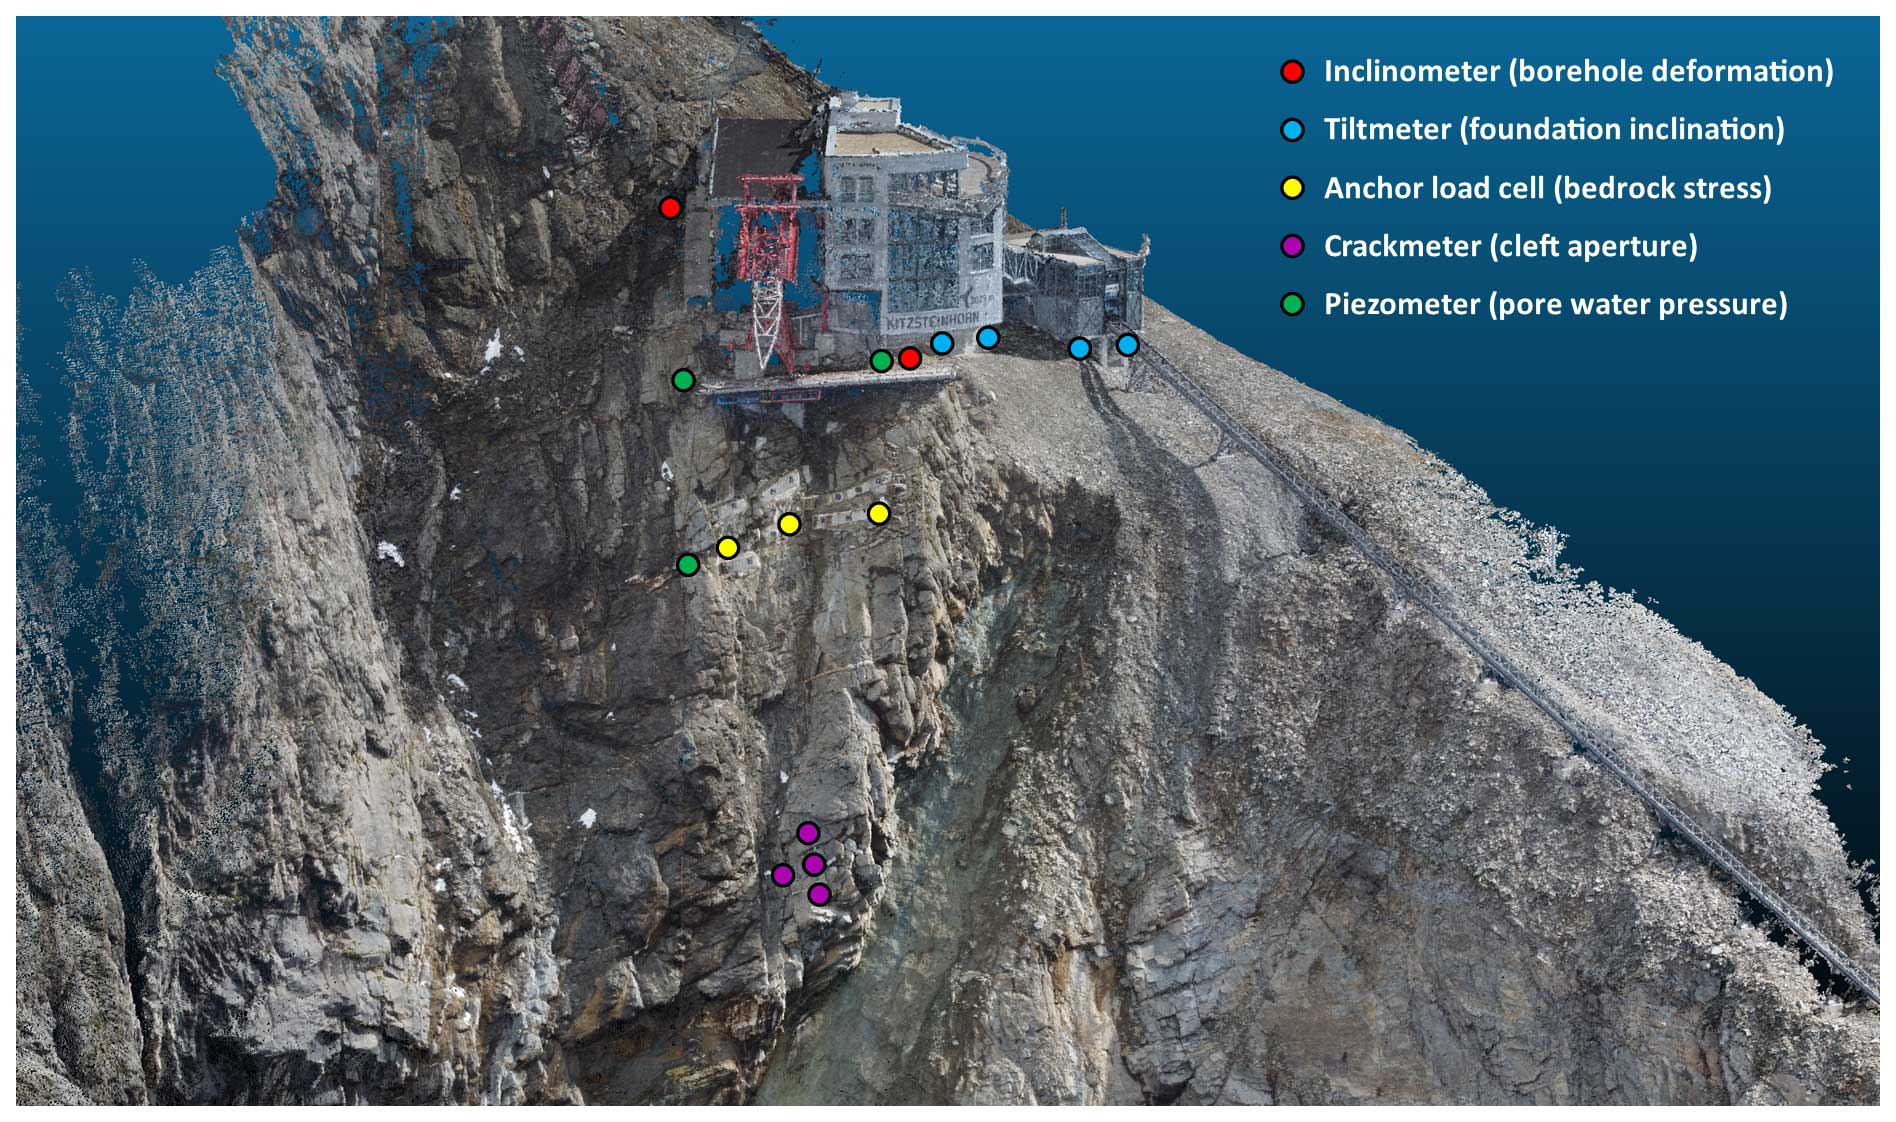
To identify and study minimal ground movement (displacement, deformation), a complementary network of geotechnical monitoring devices has been established in the surroundings of the cable car top station, which consists of the following components: (i) deep borehole deformation measurements with two biaxial inclinometer chains, (ii) inclination measurements at four building foundations with triaxial tiltmeters, (iii) bedrock stress measurements at three rock anchor heads with hydraulic anchor load cells, (iv) cleft aperture measurements with four crackmeters, and (v) pore water pressure measurements with piezometers in three deep boreholes. All instruments are connected via a wireless sensor network (Fig. 10). Data are acquired every 60 min and then transmitted via a central gateway to a web application. Pre-defined alarms enable targeted and fully automatic notification (via email and SMS) in the event of threshold exceedance or data failure. Due to the hourly data collection, rapid information and warning for the recipients is ensured (near real time).
High precision of the measurement devices used enables the identification of movements in the sub-millimeter range, thus forming the basis for the early detection of stability-relevant changes. The integration of the measuring instruments within a wireless sensor network (communication via LoRa radio communication) reduces susceptibility to lightning strike damage and significantly contributes to the robustness and efficient maintainability of the system.
-
Air temperature monitoring at three local weather stations shows a considerable warming trend of +0.08 °C yr−1 (+0.8 °C per decade) over the last 15 years. Historical climate data from nearby weather stations (Hoher Sonnblick) demonstrate significantly accelerated warming since the 1980s.
-
Over the last 70 years (1953–2023), the area of the Schmiedingerkees glacier has decreased from 2.17 to 0.71 km2 (−67 %). Area loss does not follow a linear trend but shows a clear acceleration. Extrapolation of the observed area loss suggests that the investigated glacier could disappear in the 2040s. UAV-based photogrammetry measurements show that the mean thickness of the Schmiedingerkees has reduced by more than 1 m yr−1.
-
Permafrost temperature measurement in a 30 m borehole (2016–2023) demonstrates a clear warming trend. Significant warming (∼ +0.1 °C) has been registered for near-surface regions (e.g., 2, 3 m), which is in agreement with recent air temperature rise. With increasing borehole depth, the observed warming trend is attenuated considerably to only a few hundredths of a degree per year (e.g., 15, 30 m). The maximum depth of the permafrost active layer varies around 4 m.
-
Based on 12-year rockwall monitoring with terrestrial laser scanning (2011–2023), 799 rockfall source areas with a total volume of 3340 m3 were identified. For all studied rockwalls, a significant intensification of rockfall activity was registered close to the glacier surface, i.e., in freshly deglaciated rockwall sections. Rockfall activity in these proximal areas is ca. 10 times higher than in distal areas located more than 10 m above the current glacier surface (not or only marginally affected by current glacier retreat). Mean annual rockwall retreat equaled 5.36 mm yr−1 in proximal regions and only 0.55 mm in distal regions.
All data sets are available upon request. Borehole temperature data are available via GTN-P (the Global Terrestrial Network for Permafrost) at http://gtnpdatabase.org/boreholes/view/1120/ (Hartmeyer, 2024). Rockfall data (2011–2017) are available under the following DOI: https://doi.org/10.14459/2020mp1540134 (Krautblatter, 2020).
IH: conceptualization, data curation, formal analysis, investigation, project administration, visualization, writing – original draft preparation. JCO: supervision, writing – review and editing.
The contact author has declared that neither of the authors has any competing interests.
Publisher’s note: Copernicus Publications remains neutral with regard to jurisdictional claims made in the text, published maps, institutional affiliations, or any other geographical representation in this paper. While Copernicus Publications makes every effort to include appropriate place names, the final responsibility lies with the authors.
We thank Bernhard Salcher for constructive comments on an earlier version of the paper. Funding and support by the Gletscherbahnen Kaprun AG are gratefully acknowledged.
This research has been supported by the Gletscherbahnen Kaprun AG, the Austrian Research Promotion Agency (FFG), and the Austrian Academy of Sciences (ÖAW).
Begert, M. and Frei, C.: Long-term area-mean temperature series for Switzerland – Combining homogenized station data and high resolution grid data, Int. J. Climatol., 38, 2792–2807, https://doi.org/10.1002/joc.5460, 2018.
Cornelius, H. and Clar, E.: Erläuterungen zur geologischen Karte des Glocknergebietes, Geologische Bundesanstalt, Vienna, 32 pp., 1935.
Duvillard, P.-A., Ravanel, L., Schoeneich, P., Deline, P., Marcer, M., and Magnin, F.: Qualitative risk assessment and strategies for infrastructure on permafrost in the French Alps, Cold Reg. Sci. Technol., 189, 103311, https://doi.org/10.1016/j.coldregions.2021.103311, 2021.
European Environment Agency: Regional climate change and adaptation: the Alps facing the challenge of changing water resources, Office for Official Publications of the European Communities, Luxembourg, https://doi.org/10.2800/12552, 2009.
Fischer, A., Seiser, B., Stocker Waldhuber, M., Mitterer, C., and Abermann, J.: Tracing glacier changes in Austria from the Little Ice Age to the present using a lidar-based high-resolution glacier inventory in Austria, The Cryosphere, 9, 753–766, https://doi.org/10.5194/tc-9-753-2015, 2015.
GeoSphere Austria: https://data.hub.geosphere.at (last access: 1 June 2024), 2024.
Gruber, S. and Haeberli, W.: Permafrost in steep bedrock slopes and its temperature-related destabilization following climate change, J. Geophys. Res., 112, F02S18, https://doi.org/10.1029/2006JF000547, 2007.
Hartmeyer, I.: Kitzsteinhorn 2, GTN-P – Global Terrestrial Network for Permafrost [data set], http://gtnpdatabase.org/boreholes/view/1120/, last access: 6 August 2024.
Hartmeyer, I., Delleske, R., Keuschnig, M., Krautblatter, M., Lang, A., Schrott, L., and Otto, J.-C.: Current glacier recession causes significant rockfall increase: the immediate paraglacial response of deglaciating cirque walls, Earth Surf. Dynam., 8, 729–751, https://doi.org/10.5194/esurf-8-729-2020, 2020a.
Hartmeyer, I., Keuschnig, M., Delleske, R., Krautblatter, M., Lang, A., Schrott, L., Prasicek, G., and Otto, J.-C.: A 6-year lidar survey reveals enhanced rockwall retreat and modified rockfall magnitudes/frequencies in deglaciating cirques, Earth Surf. Dynam., 8, 753–768, https://doi.org/10.5194/esurf-8-753-2020, 2020b.
Hoeck, V., Pestal, G., Brandmaier, P., Clar, E., Cornelius, H., Frank, W., Matl, H., Neumayr, P., Petrakakis, K., Stadlmann, T., and Steyrer, H.: Geologische Karte der Republik Österreich, Blatt 153 Großglockner, Geologische Bundesanstalt, Vienna, https://doi.org/10.24341/tethys.70, 1994.
Kotlarski, S., Gobiet, A., Morin, S., Olefs, M., Rajczak, J., and Samacoïts, R.: 21st Century alpine climate change, Clim. Dynam., 60, 65–86, https://doi.org/10.1007/s00382-022-06303-3, 2023.
Krautblatter, M.: Rockfall Source Areas, Kitzsteinhorn, Austria (2011–2017), TUM Technical University Munich [data set], https://doi.org/10.14459/2020mp1540134, 2020.
Krautblatter, M., Funk, D., and Günzel, F. K.: Why permafrost rocks become unstable: a rock-ice-mechanical model in time and space, Earth Surf. Proc. Land., 38, 876–887, https://doi.org/10.1002/esp.3374, 2013.
Noetzli, J., Gruber, S., Kohl, T., Salzmann, N., and Haeberli, W.: Three-dimensional distribution and evolution of permafrost temperatures in idealized high-mountain topography, J. Geophys. Res., 112, F02S13, https://doi.org/10.1029/2006JF000545, 2007.
PERMOS: Swiss Permafrost Bulletin 2022, edited by: Noetzli, J. and Pellet, C., Swiss Permafrost Monitoring Network (PERMOS), No. 4, 23 pp., 2023.
Philipona, R.: Greenhouse warming and solar brightening in and around the Alps, Int. J. Climatol., 33, 1530–1537, https://doi.org/10.1002/joc.3531, 2013.
WGMS: Global Glacier Change Bulletin No. 5 (2020–2021), edited by: Zemp, M., Gärtner-Roer, I., Nussbaumer, S. U., Welty, E. Z., Dussaillant, I., and Bannwart, J., ISC(WDS)/IUGG(IACS)/UNEP/UNESCO/WMO, World Glacier Monitoring Service, Zurich, Switzerland, 134 pp., https://doi.org/10.5904/wgms-fog-2023-09, 2023.